
BenQ EX3501R 3440×1440 21:9 35″ Curved VA monitor – AMA modes revisited for response time measurements (WHL #33F3)
Finally got a photo diode for re-measuring the panel response time of the BenQ EX3501R. It’s a Vishay BPW34 type with 7.5mm² of active area, 70pF of capacitance at 0V, 600 to 1050 nm of spectral bandwidth (Reichelt claims quite a bit more?), peak sensitivity at 900nm and a relatively big half sensitivity angle of 65 degrees. Yeah, capacitance goes down when reverse biasing it, whatever, just slap it onto a probe and let’s go:


It’s not perfectly aligned at the screen, but that shouldn’t do much. I’m running GIFs with #000000, #7F7F7F and #FFFFFF frames, flickering at 20Hz. I’m not wildly crazy, on an area of 200x200px around the diode, not the entire friggen screen (that’ll cause refreshing problems with XnView anyway). I just assume there is no huge color dependency of the response time, so White-Grey-Black will do, no need to do all permutations with colors as well. I’m also not getting paid for this like the guys over at PRAD, so let’s just do those 6 measurements in all three AMA modes and not get overly fancy. Monitor setup is Standard color profile, max brightness (no ambient sensor or user dimming), using DP at 100Hz in native resolution. Scope setup (DS1054Z) is pretty straight forward, 10X probe setting, 20M bandwidth limit, 20mV/div and 5ms/div. As AC coupling does fuck with the readings quite a bit due to the relatively slow changes, I set DC coupling and some offset depending on the test image and adjusted the trigger accordingly. This means that I have to correct X and Y plot position for the individual traces, but that’s not taking very long compared to the rest of the data processing steps. I’ve included the raw data plots of both data sets with 120k points points per set (~84k visible). The plots with data averaging ran something like
awk 'BEGIN{FS=",";num=50}{sum+=$2;if(NR==1){print $1","$2}else if(NR%num==1){print $1","sum/num;sum=0}}' pff00.csv > pff00m.csv
on the preprocessed raw csv files that apparently need their comma replaced with some space for gnuplot to correctly pick up the colums:
sed -i 's/\,/ /g' *.csv
So here’s the uphill battle, going from Black to White, Black to Grey, and Grey to White: (please click the image for a larger version)
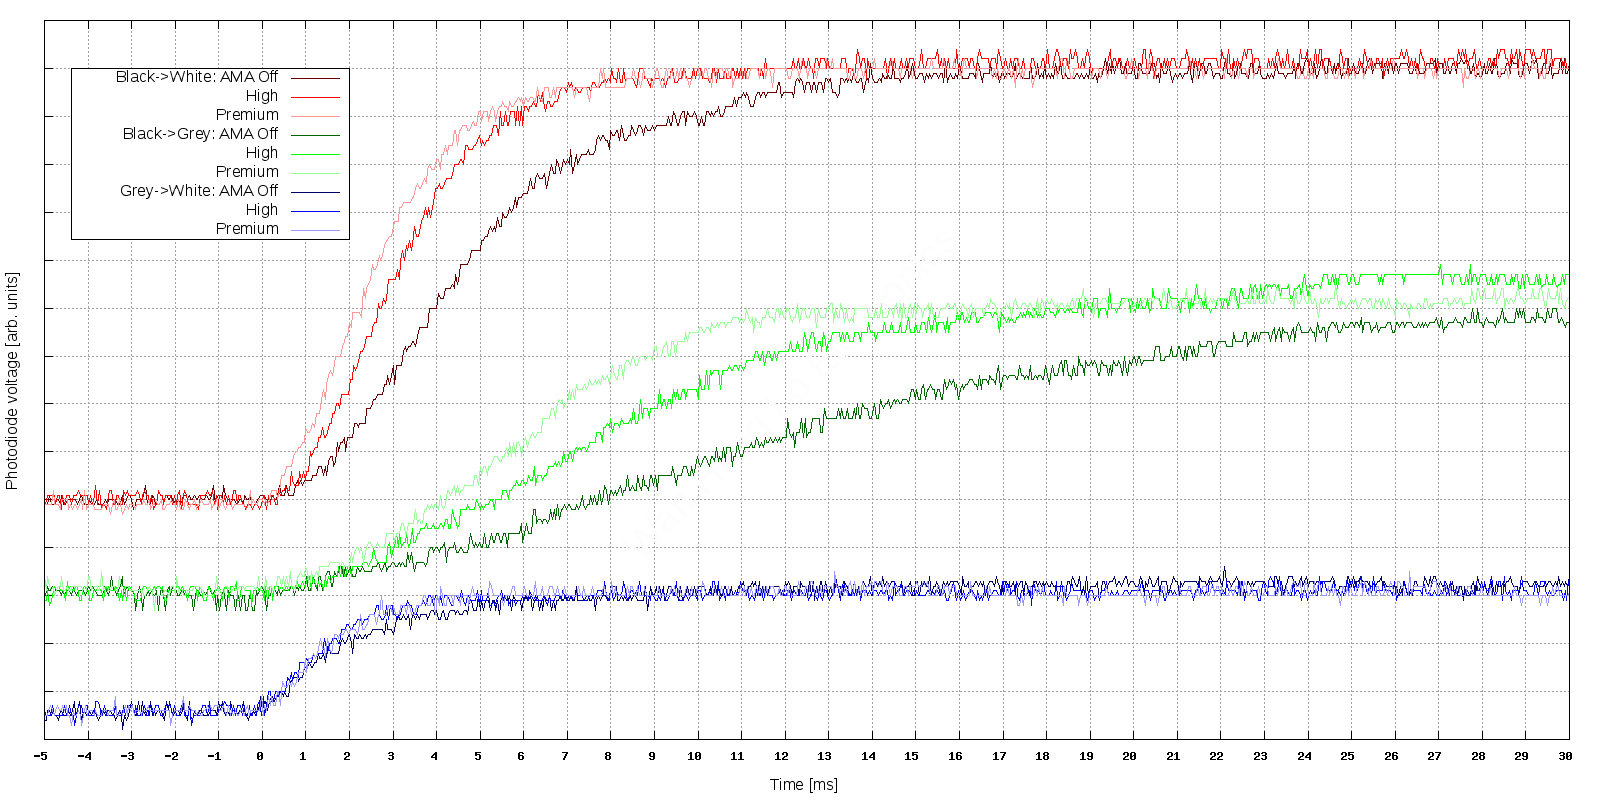
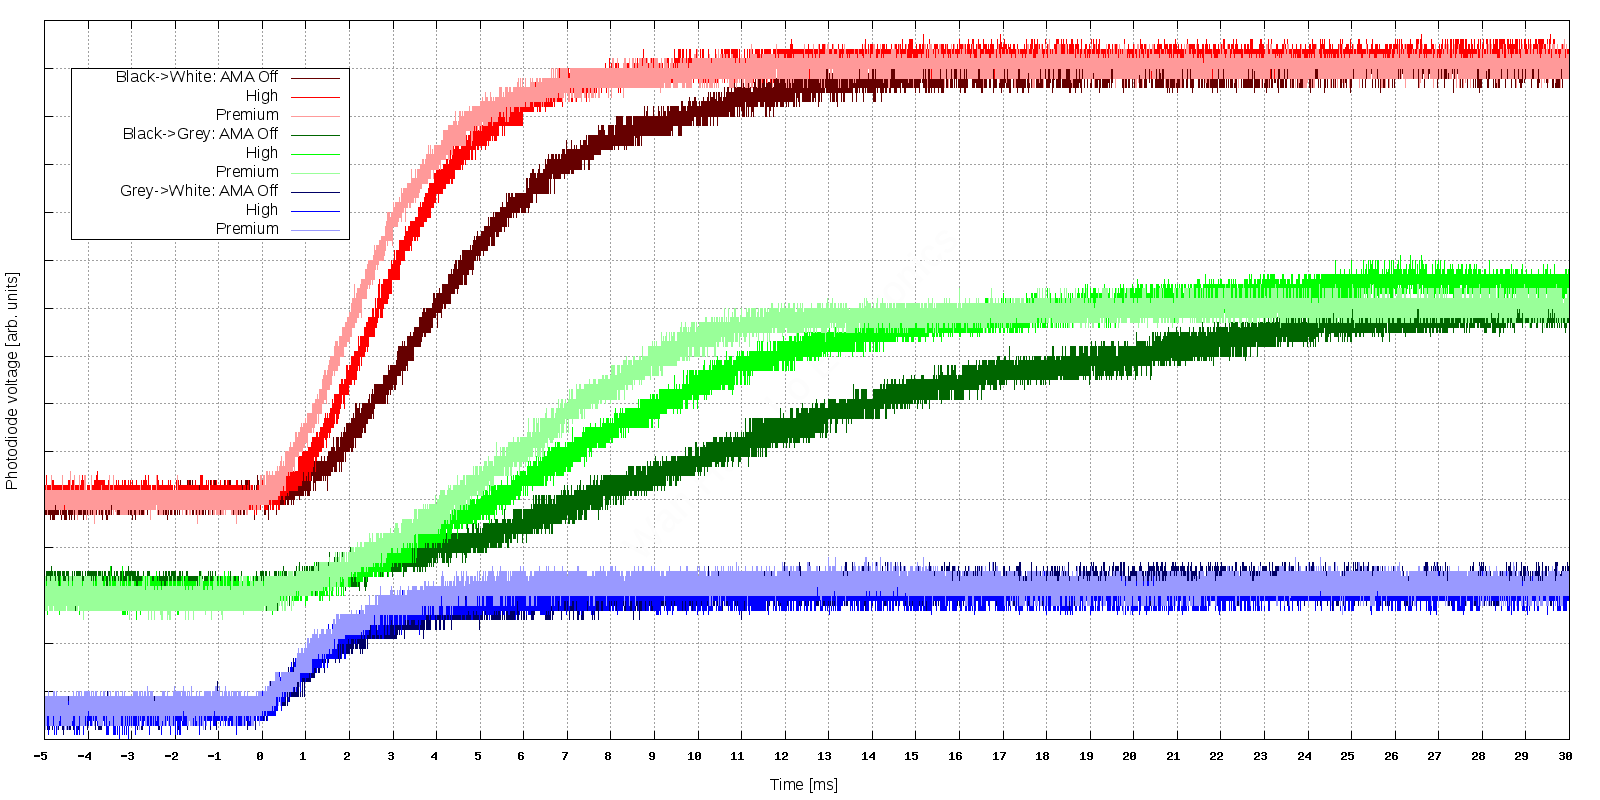
Not that shabby, isn’t it? The data…not the performance ![]()
Starting with G2W, that’s done in not much more than 3ms in all three AMA modes. One can see the “Off” mode being a little slower, but they all transition really fast and in a smooth curve that tapers off like exponential curves do. There’s no overshoot in any mode, but “Off” is being extra cautious not to cross the target value.
B2W is always the easiest, as it transitions from one extreme to the other, and the voltages to do so should be known best. Now we have a clear distinction between the modes, with “Off” obviously being the slowest, with a slight dent before reaching the target value. To me, the plot of the raw data shows this a tad better. This is not an artifact of acquisition, I did numerous takes to find a representative trace of the actual wave form. I wonder how this was so easy to see in my crude previous measurements…still, even in “Off” mode it takes around 10ms to complete 90% of the transition, and maybe 15ms to do the entire B2W change. For “High”, that is 6ms and 8ms, and for “Premium” we’re talking about 5ms and 8ms. I think once again the raw data plot shows the difference a bit better, with “Premium” going faster from start to 3/4, but tapering off slower than “High” in the end. Again, we do not have an overshoot, but this is the black to white transition, so even if the panel is driven with voltages that are above the long term stable values, they only last for less than four milliseconds.
B2G..oh boy. What is that? Again a clear distinction between the three modes, but look at that timing! “Off” doesn’t even reach equilibrium in 30ms. Slooowly rising, with some plateaus in between..sorry BenQ, that’s horrific. “High” now shows a slight overshoot and several steps in the process, but even that takes 22ms to reach the grey value and the overshoot settling time exceeds the 30ms mark as well. Even “Premium” (which does really well…in comparison) takes 10ms for 90% and another 2ms to complete the entire transition. Just a quick reminder: The panel is running at 100Hz, so 10ms per frame. So for B2G and most likely G2G transitions, the display never actually settles before the next picture comes in? Da fuq?
Now here’s the same stuff backwards again – White to Black, White to Grey and Grey to Black:
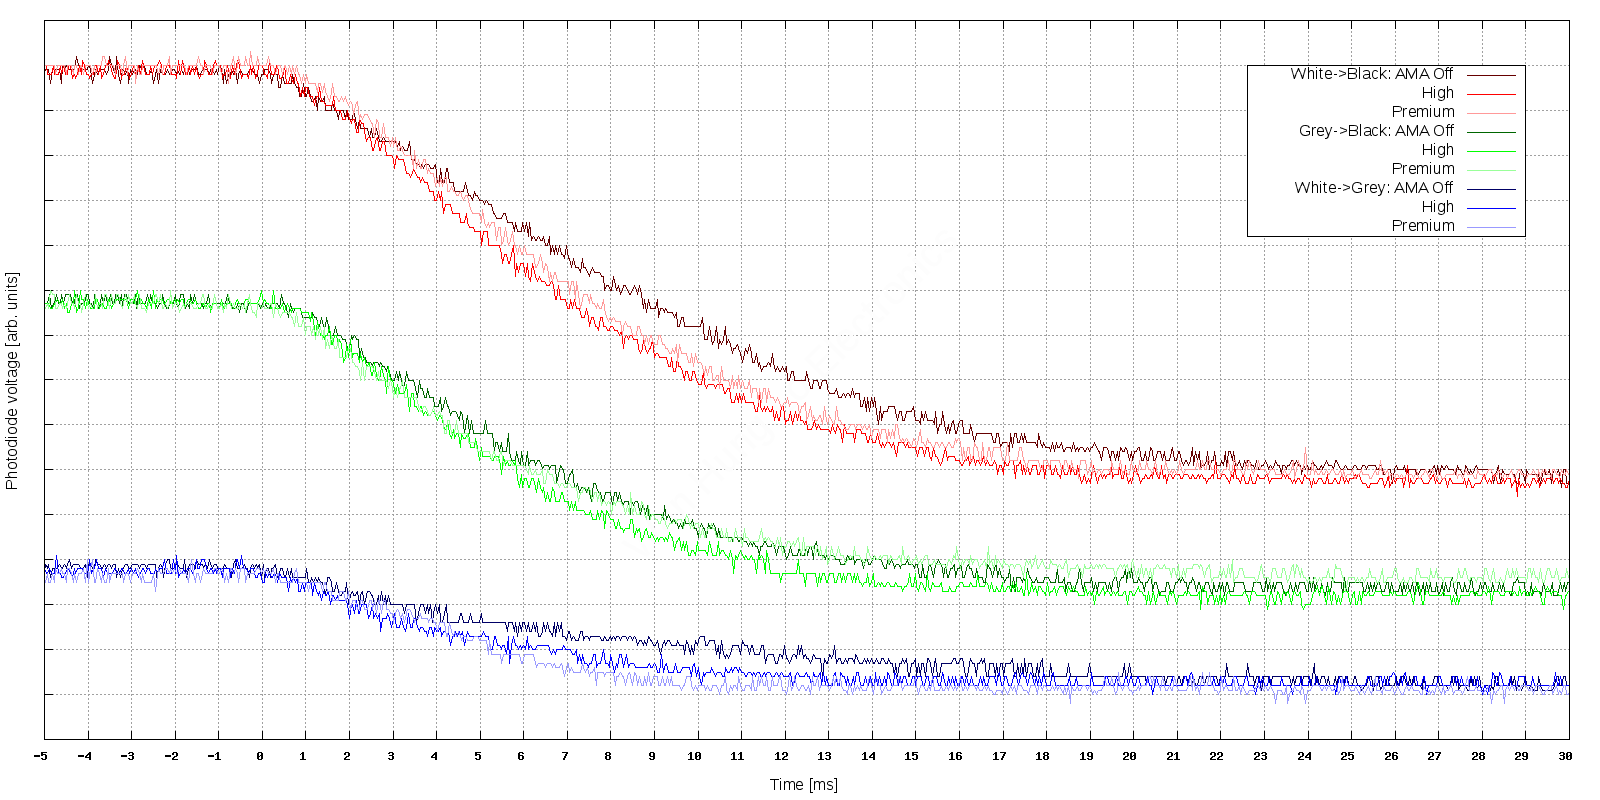
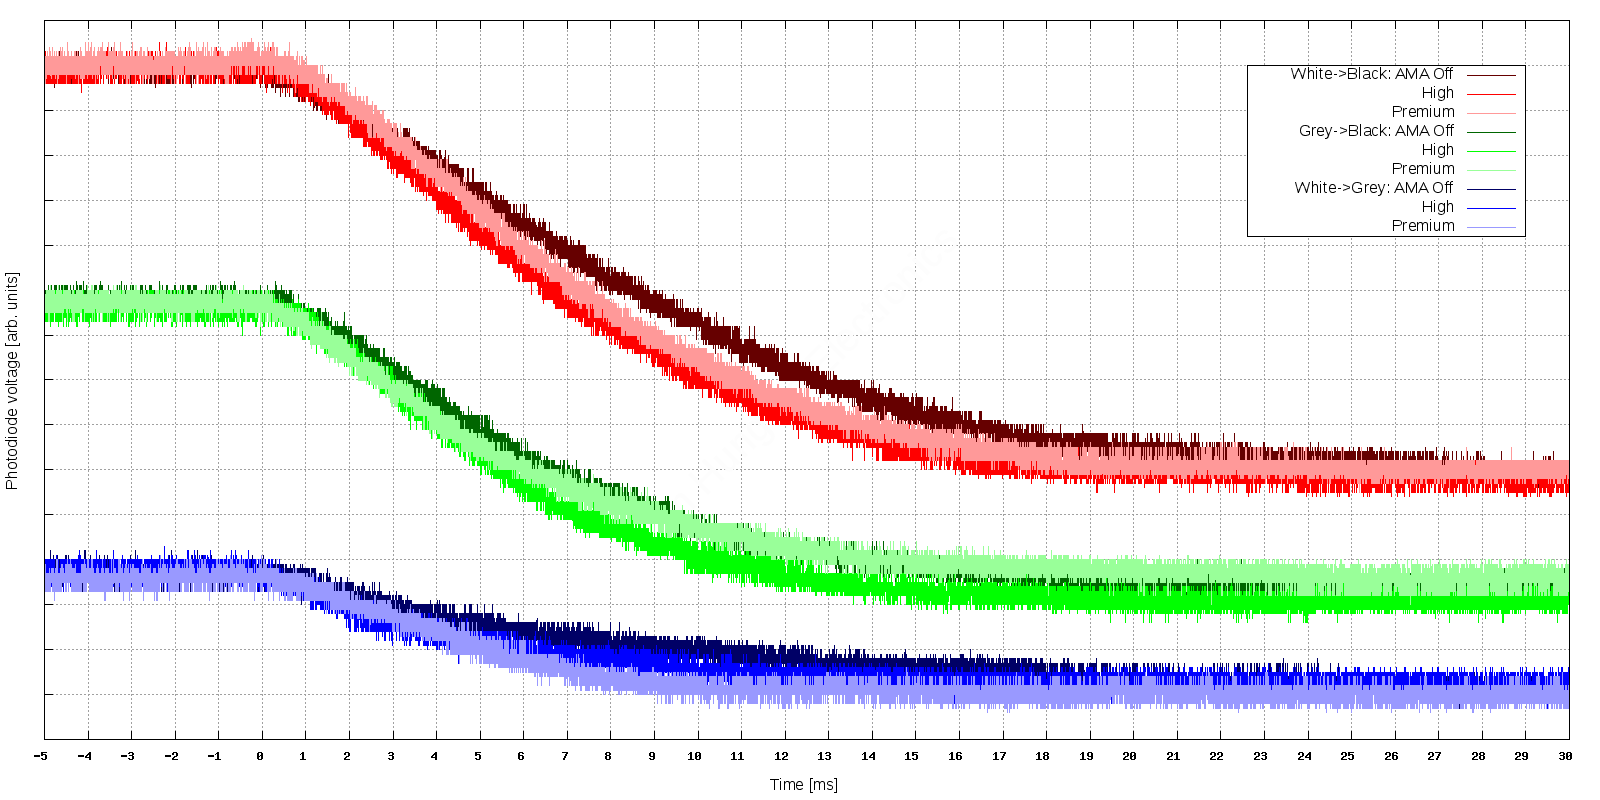
The good news: Modes are a bit more consistent and there is no undershoot. The bad news: There’s multi-phase transitions with plateau phases once again, and performance is even worse. Much worse. I’m not entirely sure how they drive these VA panels, but I guess when going up in brightness, one can add a little more voltage than when they go down. They’ll probably not go negative or as negative as they drive the panel in the opposite direction. After all, in VA panels the crystals need to move and rotate, which takes more time than just rotating them in IPS panels. Maybe they block each other and we have a diffusion process going on that isn’t much accelerated by applying a voltage?
So, for the W2G transition, we’re now talking about 20ms (90%ish) to 30ms for the full swing in “Off” mode, 10ms / 15ms for “High” and 8ms / 12ms in “Premium”. For comparison: G2W was done and dusted in 3ms regardless of the mode. Sheesh…
W2B now takes 15ms / 30ms for “Off” and around 13ms/16ms for both other modes. Even that is double the amount of the panel going the opposite direction.
And the beloved G2B…well, this time, “Off” and “Premium” compete for the third place, while “High” is a tad faster. But again, 12ms / 18ms is nothing to write home about, and the others do it in 15ms / 22ms. That’s comparable to B2G, but the display is advertised with “12ms” for t_rise plus t_fall (so the entire cycle, not just one way) and “4ms” G2G (whatever their grey values are – 7F and 80, maybe?). Not sure if the data acquisition rack in the BenQ labs is rotating at relativistic speeds around the stationary device under test – or if it’s just the usual marketing wank for a sub par gaming monitor.
Guess that’s it for today, I still need to figure out how to get the VESA adapter from BenQ. It’s not sold anywhere else, and I’m not very fond of throwing 50 bucks at them for a shitty piece of metal plate with some holes in it. Not adding this to the package contents of a 800€ display itself is one thing, but not making it available for purchasing at the usual suspects (or any weird and unknown shop at all) is a different story. But for the moment I don’t see many alternatives, the ASUS ROG Strix XG35VQ isn’t doing any better, it’s the same panel in a RGB shell (fap, fap…) designed for a pubescent audience. At 850€ including VESA adapter mounts, I don’t see the point in already exchanging the BenQ for that. CES also was a bit boring, and I don’t see any replacement coming in the next few months. Maybe one day Eizo will show some mercy and actually offer a Foris branded 21:9 display? I’d shell out a nice chunk of money for that. Hear me, Eizo? ![]()
[…] post is partially outdated – please have a look at the updated version #33F3 with proper photo diode measurements as […]